Menu

YMCA OF
GREATER KANSAS CITY

YMCA OF GREATER KANSAS CITY

Annual Report

92,702 Lives Touched in 2024

Thank you for your continued support and passion for the Y! As we reflect on 165 years impact, we are humbled and grateful for the donors and volunteers who make it possible. We couldn’t do it without you.

View our Annual Report below to learn more.

Thanks to Our Supporters

Thanks to all who give to the Y to build a better community! Because of the generosity of donors, the YMCA of Greater Kansas City is able to offer scholarships for programs and services to all in need of Y programs and services, regardless of their ability to pay.

View Donors

Every Gift Counts

Every dollar that supports our Y stays in our greater Kansas City to transform lives and strengthen our community by helping to ensure equity of access to Y programs and membership. Fight hunger, provide child care for working families, prevent social isolation for seniors, prevent drowning and more.

Leading the Way

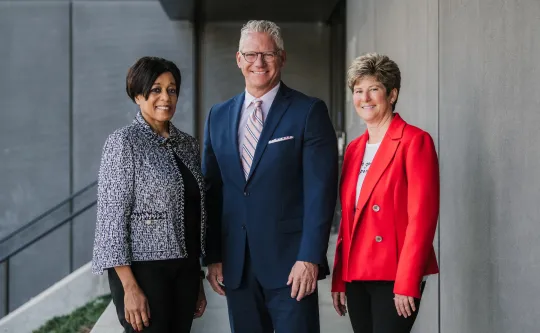
Thanks to our Board of Directors for volunteering their time to govern our Y. The YMCA of Greater Kansas City Board of Directors works closely with the senior leadership staff team to strengthen the community through youth development, healthy living and social responsibility.


Transforming Lives

For 165 years, one heartbeat has echoed through Kansas City—the pulse of the Y. More than just a building, the Y is a foundation where lives are transformed. Our story isn’t written in brick and mortar, but in the lives we’ve touched, generations uplifted and communities strengthened.


2024 Financials

PUBLIC SUPPORT Circle Graph. Contributions $2,650,815. United Way $163,693. Fees & Grants from Government Agencies $8,625,268. TOTAL SUPPORT $11,439,776. EARNED REVENUE Membership $13,671,962. Programs $17,199,667. Investment Income $1,049,368. TOTAL REVENUE $31,920,997. TOTAL PUBLIC SUPPORT AND EARNED REVENUE $43,360,773.

PROGRAM EXPRENSES. Circle Graph. Healthy Living $10,707,967. Youth Development $19,371,106. Head Start $5,765,194. TOTAL PROGRAM SERVICES $35,844,267. ALLOCATED EXPENSES Circle Graph. Supporting Services to Programs $6,451,914. Financial Costs $804,597. Change in Net Assets $259,995. TOTAL ALLOCATED EXPENSES & NET ASSET CHANGES $7,516,506. TOTAL PROGRAM SERVICES & ALLOCATED EXPENSES $43,360,773.

Past Annual Reports

2023 Annual Report

2022 Annual Report

2021 Annual Report

2020 Annual Report

2019 Annual Report